Week 10
machine making
Assignment Prompt
Make a serious attempt at the most challenging/intimidating aspect of your final project.
Introduction
The most challenging portion of my final project is certainly cretaing the load cell. When I went to OH to recieve help with using the water jet cutter, though, I was told that none of the TFs could give me an orientation and to wait for Nathan's office hours, which, unfortunately, were after the due date for this assignment. In addition, the strain gauges for my load cell had not arrived until fairly late. Regardless, I decided to focus my attention to the second most challenging part: the software for my project.
Software Features
My original thinking was to have the ESP32 Xiao connect to an iPhone application that I would create using Bluetooth. This proved to be incredibly difficult, though, as I could find no examples of custom applications using any platform other than MIT's Scratch-inspired application builder, which did not offer the features I was interested in (to my knowledge). Instead, I chose to use the AsyncTCP library, which allowed me to host a website on my local WiFi and access it through any other device on that WiFi.
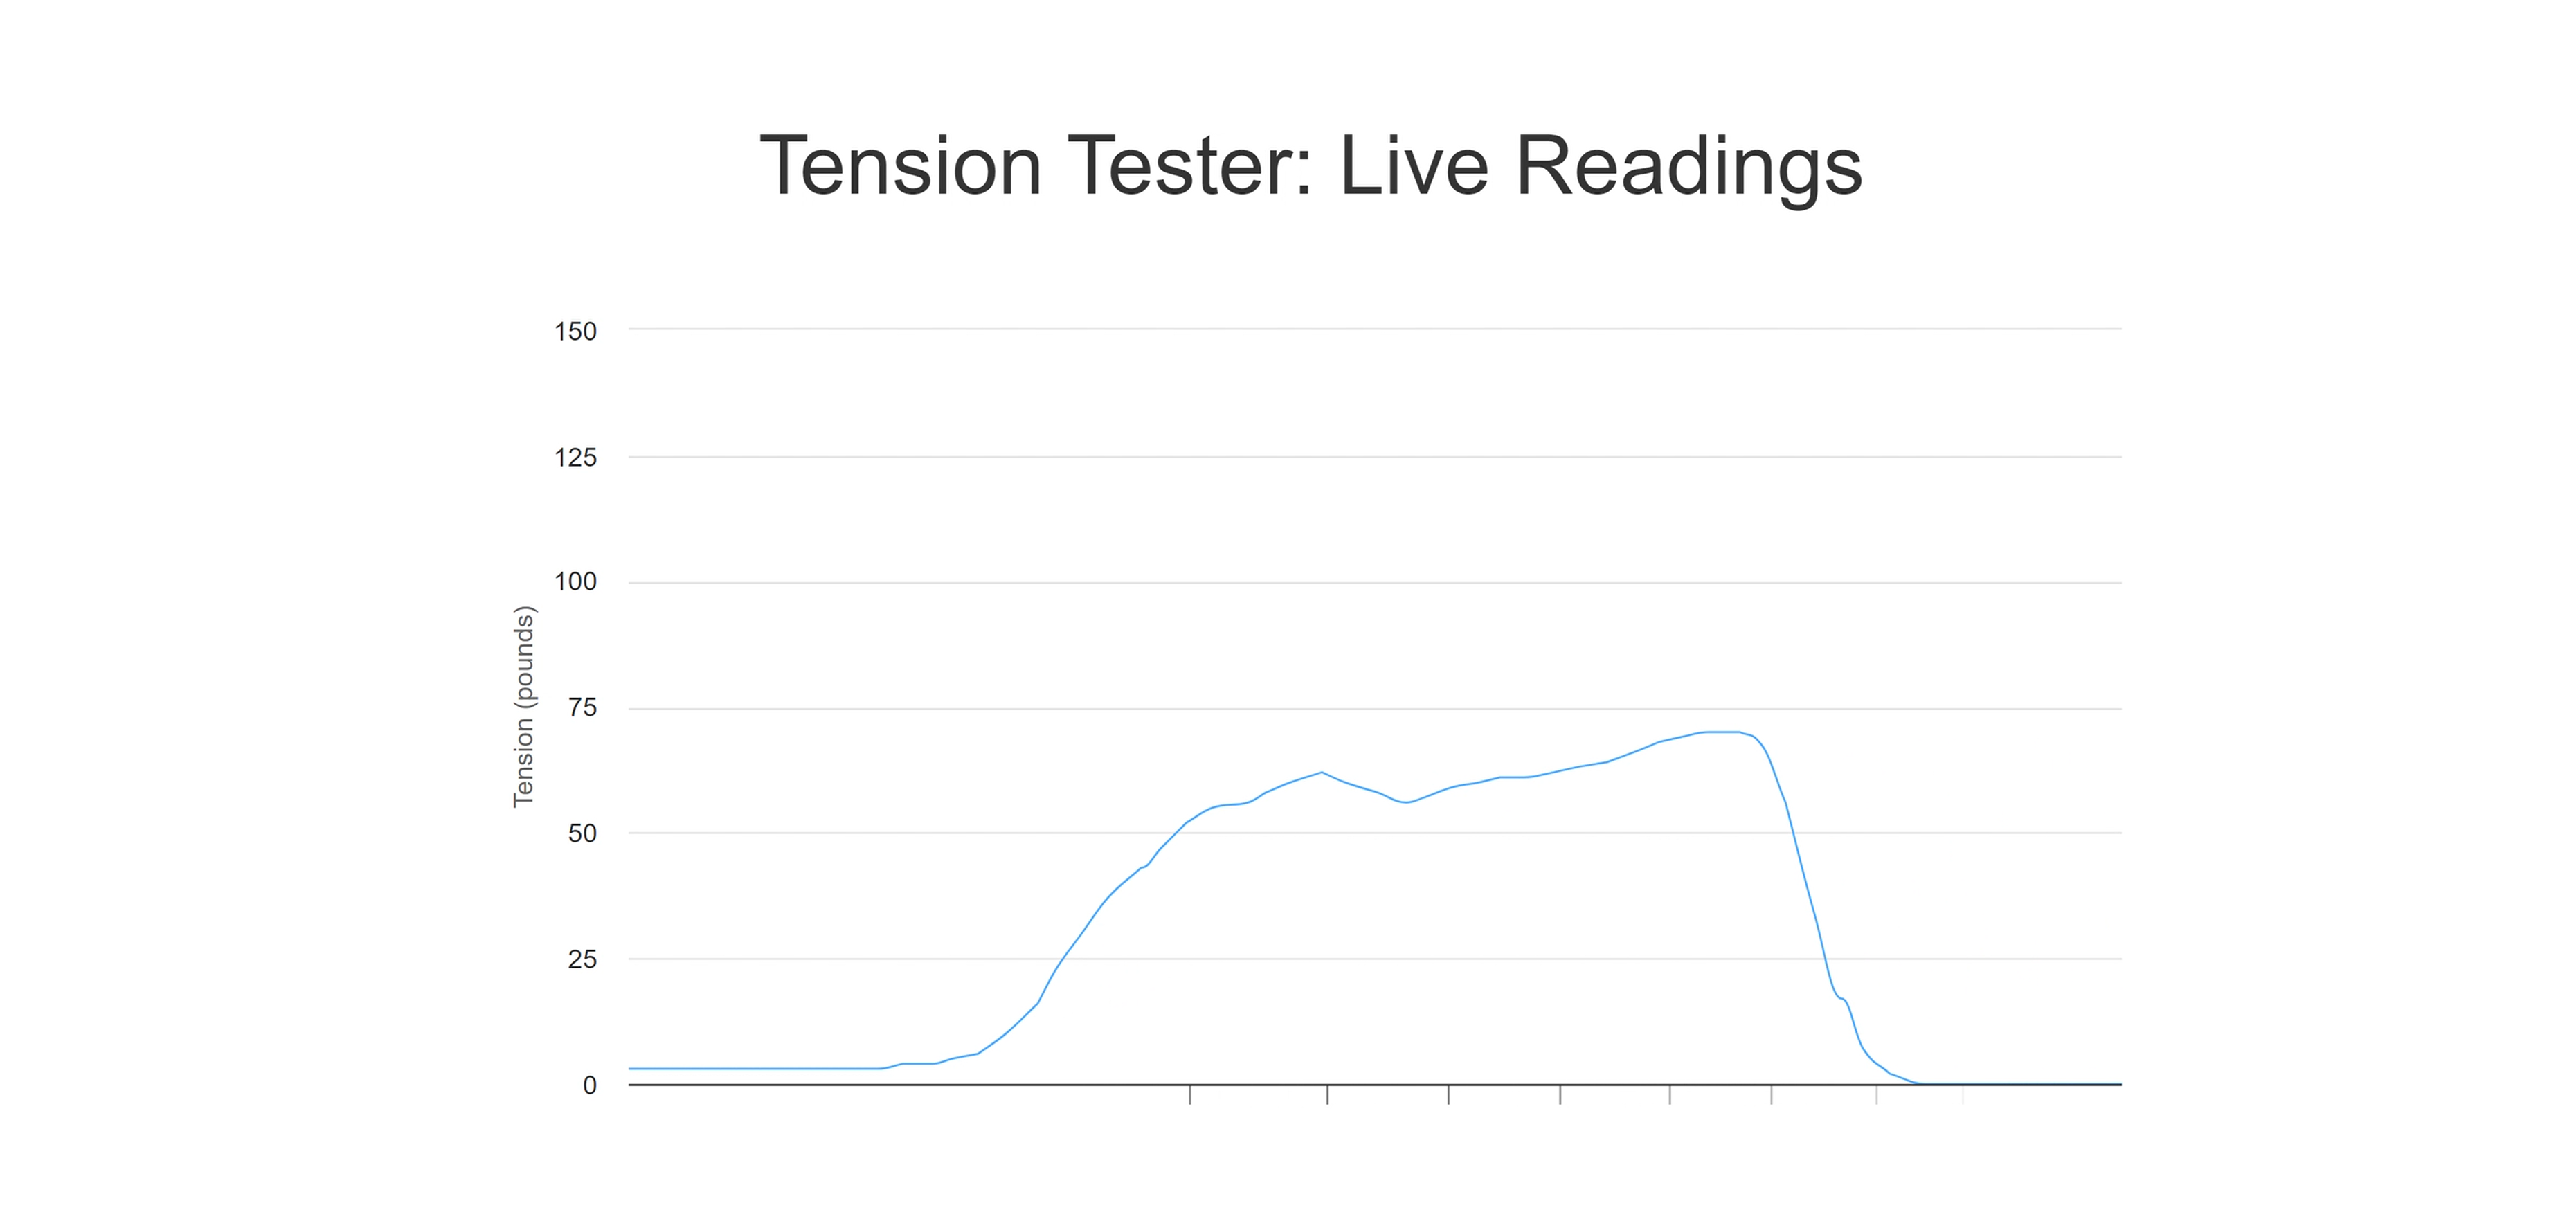
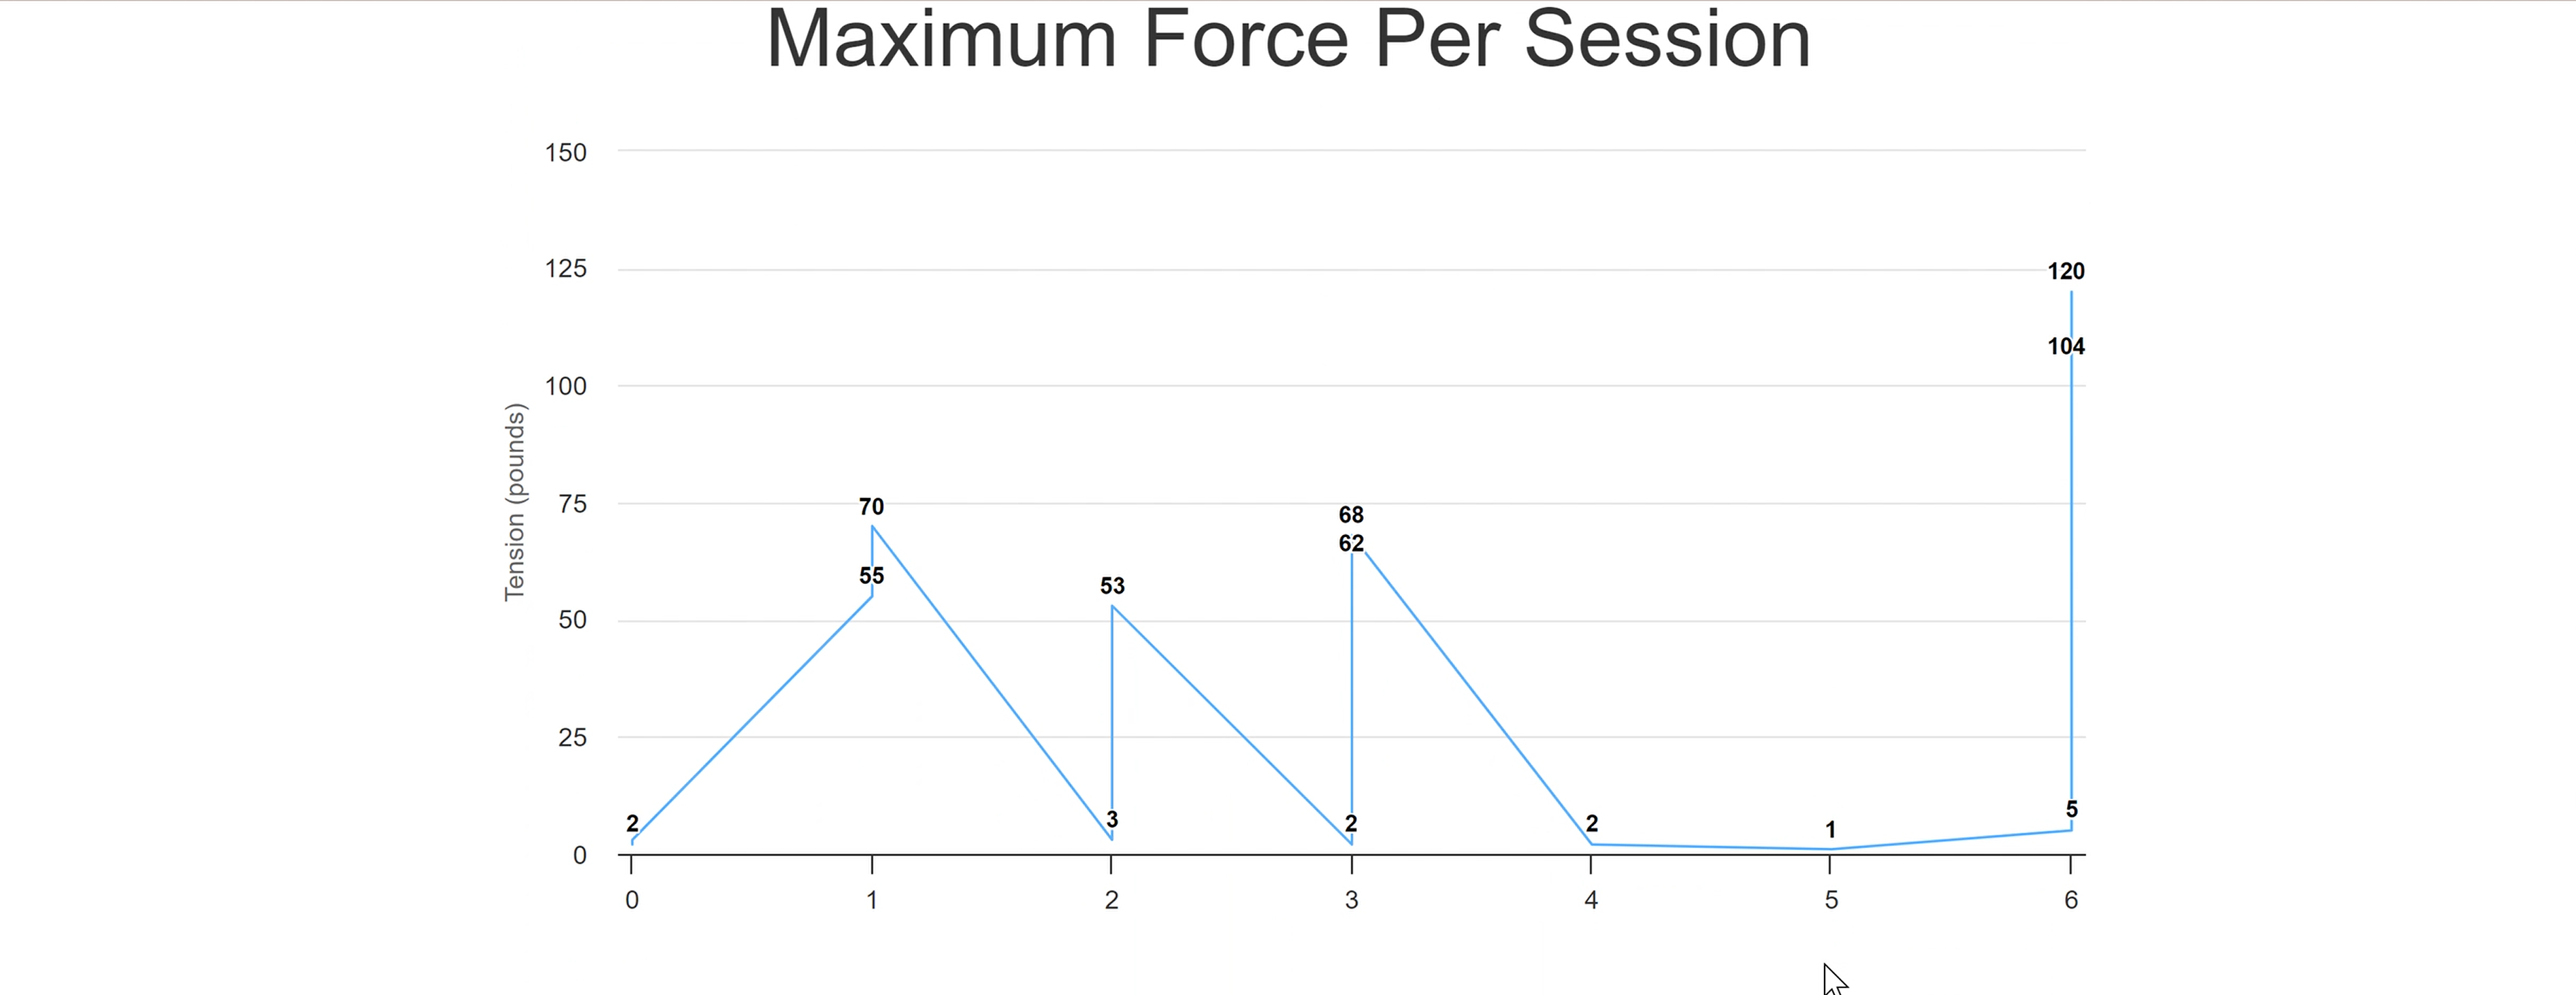
The main feature of my site would include live tension readings from the device. The data updates every 100ms and is displayed in units of pounds. The second feature would be to identify "sessions," periods of activity for the device. My final project is meant to be used in increments of a few seconds at a time; that is, someone using it will pull as hard as they can for a few seconds, rest, and then repeat the process a few times to see how their maximum pulling force decays over time. By detecting and plotting these "sessions," or periods of pulling activity, you could more closely view and analyze your performance. It would also cut down on the need to save the garbage data (mostly 0s) that the device reads during periods of non-use. The last feature would be to identify and plot the maxima of these sessions over time. This would tell us not only the maximum pulling force, but it would also tell us how the maximum pulling force decays over time.
Libraries
This is where the trouble started. In order to host my site, I had to be able to upload the index.html file to the ESP32 Xiao for hosting. This required a tool, the ESP32 Filesystem Uploader, which was only available on Arduino v1.8.x, an older version. After much fiddling, I figured this out and successfully installed the tool, which allowed me to upload my index.html file to the ESP32 Xiao's Flash data.
The second library I made use of was a JavaScript library called Highcharts.js, a JavaScript library for creating interactive charts and graphs on web pages. This was significantly less of a challenge, though navigating the choppiness of the animation of the live data chart was a struggle that required much documentation-reading and ChatGPT querying.
Sending Data from ESP32 to JavaScript
Once the ESP32 Xiao is hosting the website on our local WiFi, we can access the website through the Serial Monitor, where the IP address it is hosted at will be printed. The following lines in the Arduino code trigger a reading of the load cell upon accessing "/force" at the aforementioned IP.
server.on("/force", HTTP_GET, [](AsyncWebServerRequest *request){
    request->send_P(200, "text/plain", readweight().c_str());
});
Once this data is sent to "/force", the following lines in the JavaScript read that data and add it to local data variables and the live force chart.
let xhttp = new XMLHttpRequest();
xhttp.onreadystatechange = function () {
    if (this.readyState == 4 && this.status == 200) {
        let x = (new Date()).getTime(),
            y = parseFloat(this.responseText)

        data.push(y)
        liveForceChart.series[0].addPoint([x, y], true, false, false)

        if (liveForceChart.series[0].data.length > 40) {
            liveForceChart.series[0].addPoint([x, y], true, true, false);
        }
        else {
            liveForceChart.series[0].addPoint([x, y], true, false, false);
        }
    }
};
xhttp.open("GET", "/force", true);
xhttp.send();
Live Force Chart
The live force chart feature implementation was fairly simple. I created a function, updateChartData(), which would query the load cell for data every 100ms and add the newly recieved data points to the live force chart using he Highcharts.js library. In the code below, there is reference to a global variable, "paused", which, if false, allows the updateChartData() function to continue its recursion. This is reference to a "pause reading from the load cell" feature I had hoped to implement but did not have time to. In all of this code, we can assume it is always false and therefore does not impact the code significantly.
function updateChartData() {
    let xhttp = new XMLHttpRequest();
    xhttp.onreadystatechange = function () {
        if (this.readyState == 4 && this.status == 200) {
            let x = (new Date()).getTime(),
                y = parseFloat(this.responseText)

            data.push(y)
            liveForceChart.series[0].addPoint([x, y], true, false, false)

            if (liveForceChart.series[0].data.length > 40) {
                liveForceChart.series[0].addPoint([x, y], true, true, false);
            }
            else {
                liveForceChart.series[0].addPoint([x, y], true, false, false);
            }
        }
    };
    xhttp.open("GET", "/force", true);
    xhttp.send();
    update_axes();

    if (!paused) {
        setTimeout(updateChartData, 100);
    }
}Session Identification
Identifying sessions is not a matter of identifying activity; rather, it is a matter of identifying inactivity. Sessions are periods of activity marked by longer periods of inactivity in between. As such, my method for identifying sessions followed this logic. If the current force reading surpasses some threshold AND the previous reading falls UNDER this threshold, a session is started. If the current force reading falls under some threshold AND the previous reading SURPASSES this threshold, a session is ended.
// Identifies a "session," a period of activity in which the user is exerting force on the device
identify_sessions = (data, threshold) => {
let sessions = [[]] // sessions[i][j] = jth datapoint of session i
let session_num = 0
// loop through data and add sessions to the sessions array when applicable
for (let i = 0; i < data.length; i++) {
if (data[i] >= threshold) {
sessions[session_num].push(data[i])
}
else if (sessions[session_num].length > 0) {
session_num++
sessions[session_num] = []
}
}
// create and return final array of sessions. filter out particularly short ones.
let sessions_final = sessions.filter(session => session.length > 5)
// loop through the newly added sessions and add option to display session data to select
for (let i = previous_session; i < sessions_final.length; i++) {
let new_select = $("<option>").val(i).text("Session " + (i + 1));
$("#select_session").append(new_select);
}
previous_session = sessions_final.length
return sessions_final
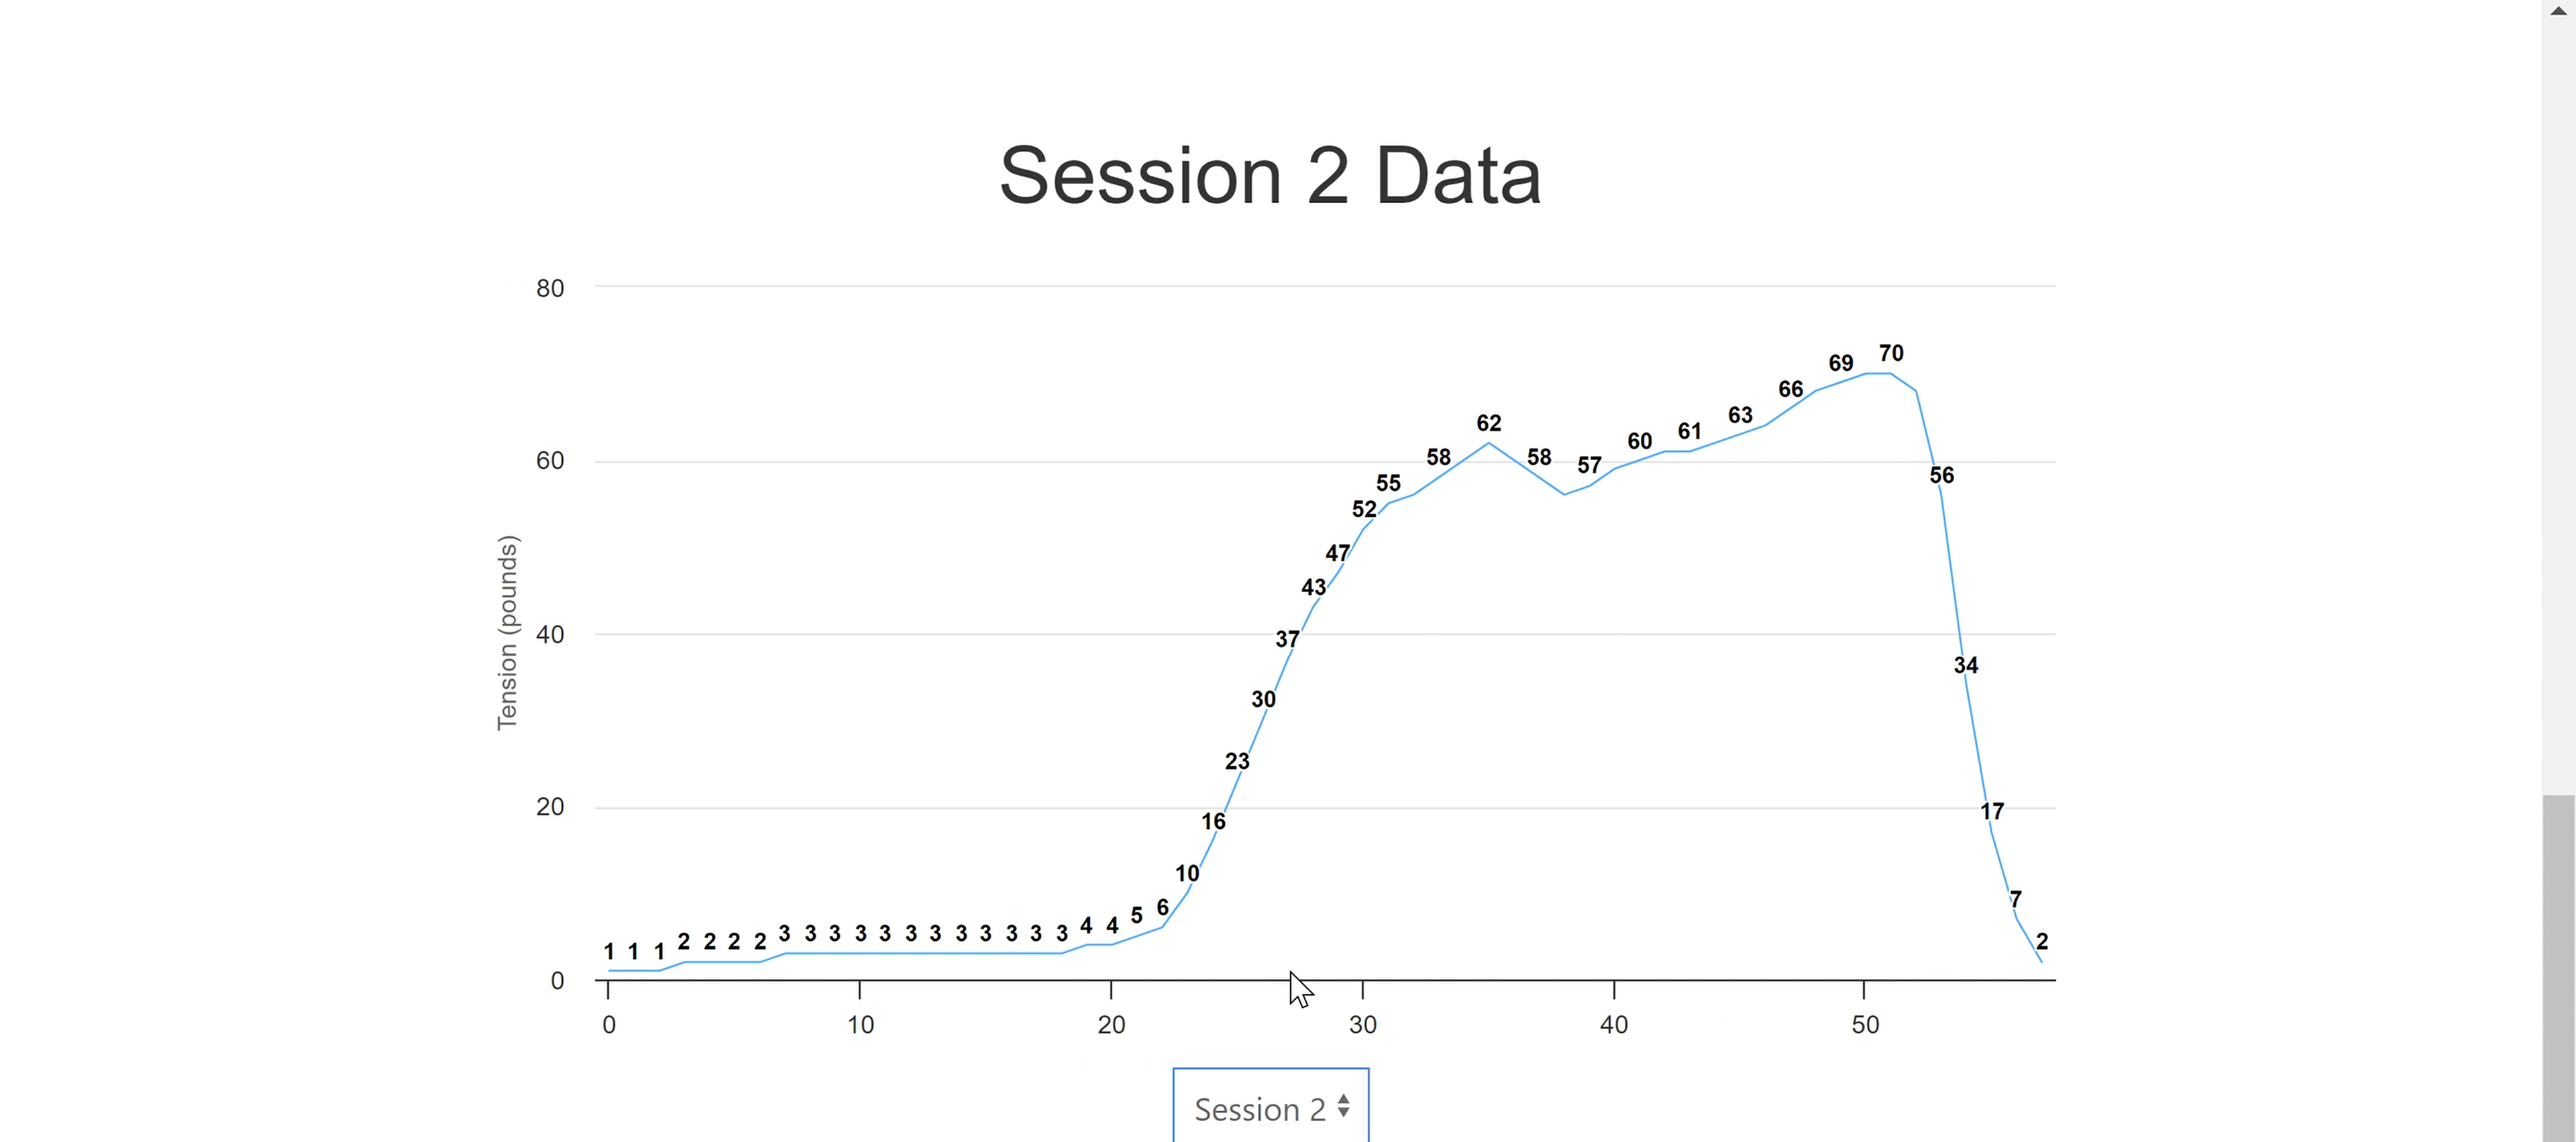
}The code above is set to run once every few seconds. Thus, sessions are often added well after the fact but accounts for overlap or adjusted sessions by readjusting the entire list of sessions each time it is called. This function also adds an option for each of the sessions to a select element in the HTML using jQuery. This is for the viewing of these sessions. Once a user selects a session to view, we use jQuery to display that session's data in a chart as such:
$("#select_session").on("change", function () {
    if ($(this).val() != "none") {
        let session = parseInt($(this).val())
        let chart_data = sessions[session]
        if (sessionForceChart.series[0].data.length > 0) {
            sessionForceChart.series[0].remove(true)
            sessionForceChart.addSeries({
                showInLegend: false,
                data: [],
                lineWidth: 1
            })
        }
        for (let i = 0; i < chart_data.length; i++) {
            sessionForceChart.series[0].addPoint([i, chart_data[i]], true, false, false);
        }
        $("#session-chart-title").text("Session " + (session + 1) + " Data")
        $("#session_chart").show();
        $("#indivdual_session_data").hide();
    }
    else {
        $("#session_chart").hide();
        $("#indivdual_session_data").show();
    }
});
Session Maxima
Finding the maximum of an array of data is simple. Using the session data array, I simply found and plotted the max of each using Highcharts.js.
// Identify the maximum of the sessions.
identify_max = (sessions) => {
    let max = []
    for (let i = 0; i < sessions.length; i++) {
        max.push(Math.max(...sessions[i]))
    }
    return max
}
// add datapoints to sessions every second and plot the maximum of each
setInterval(function () {
sessions = identify_sessions(data, threshold)
max = identify_max(sessions)
for (let i = 0; i < max.length; i++) {
maxForceChart.series[0].addPoint([i, max[i]], true, false, false);
}
update_axes()
}, 3000)