Week 6
electronic input devices
Assignment Prompt
-
Make a capacitive sensor to measure a physical quantity with your microcontroller. Avoid the delay() function; use timers instead. Include schematics of the sensor. Calibrate the sensor by plotting points on a graph. Discuss the relationship between the signals recorded by your microcontroller and the physical quantities that you're measuring.
-
Choose a sensor from the lab. Include schematics of the sensor. Calibrate the sensor by plotting points on a graph. Discuss the relationship between the signals recorded by your microcontroller and the physical quantities that you're measuring.
Sensor
-
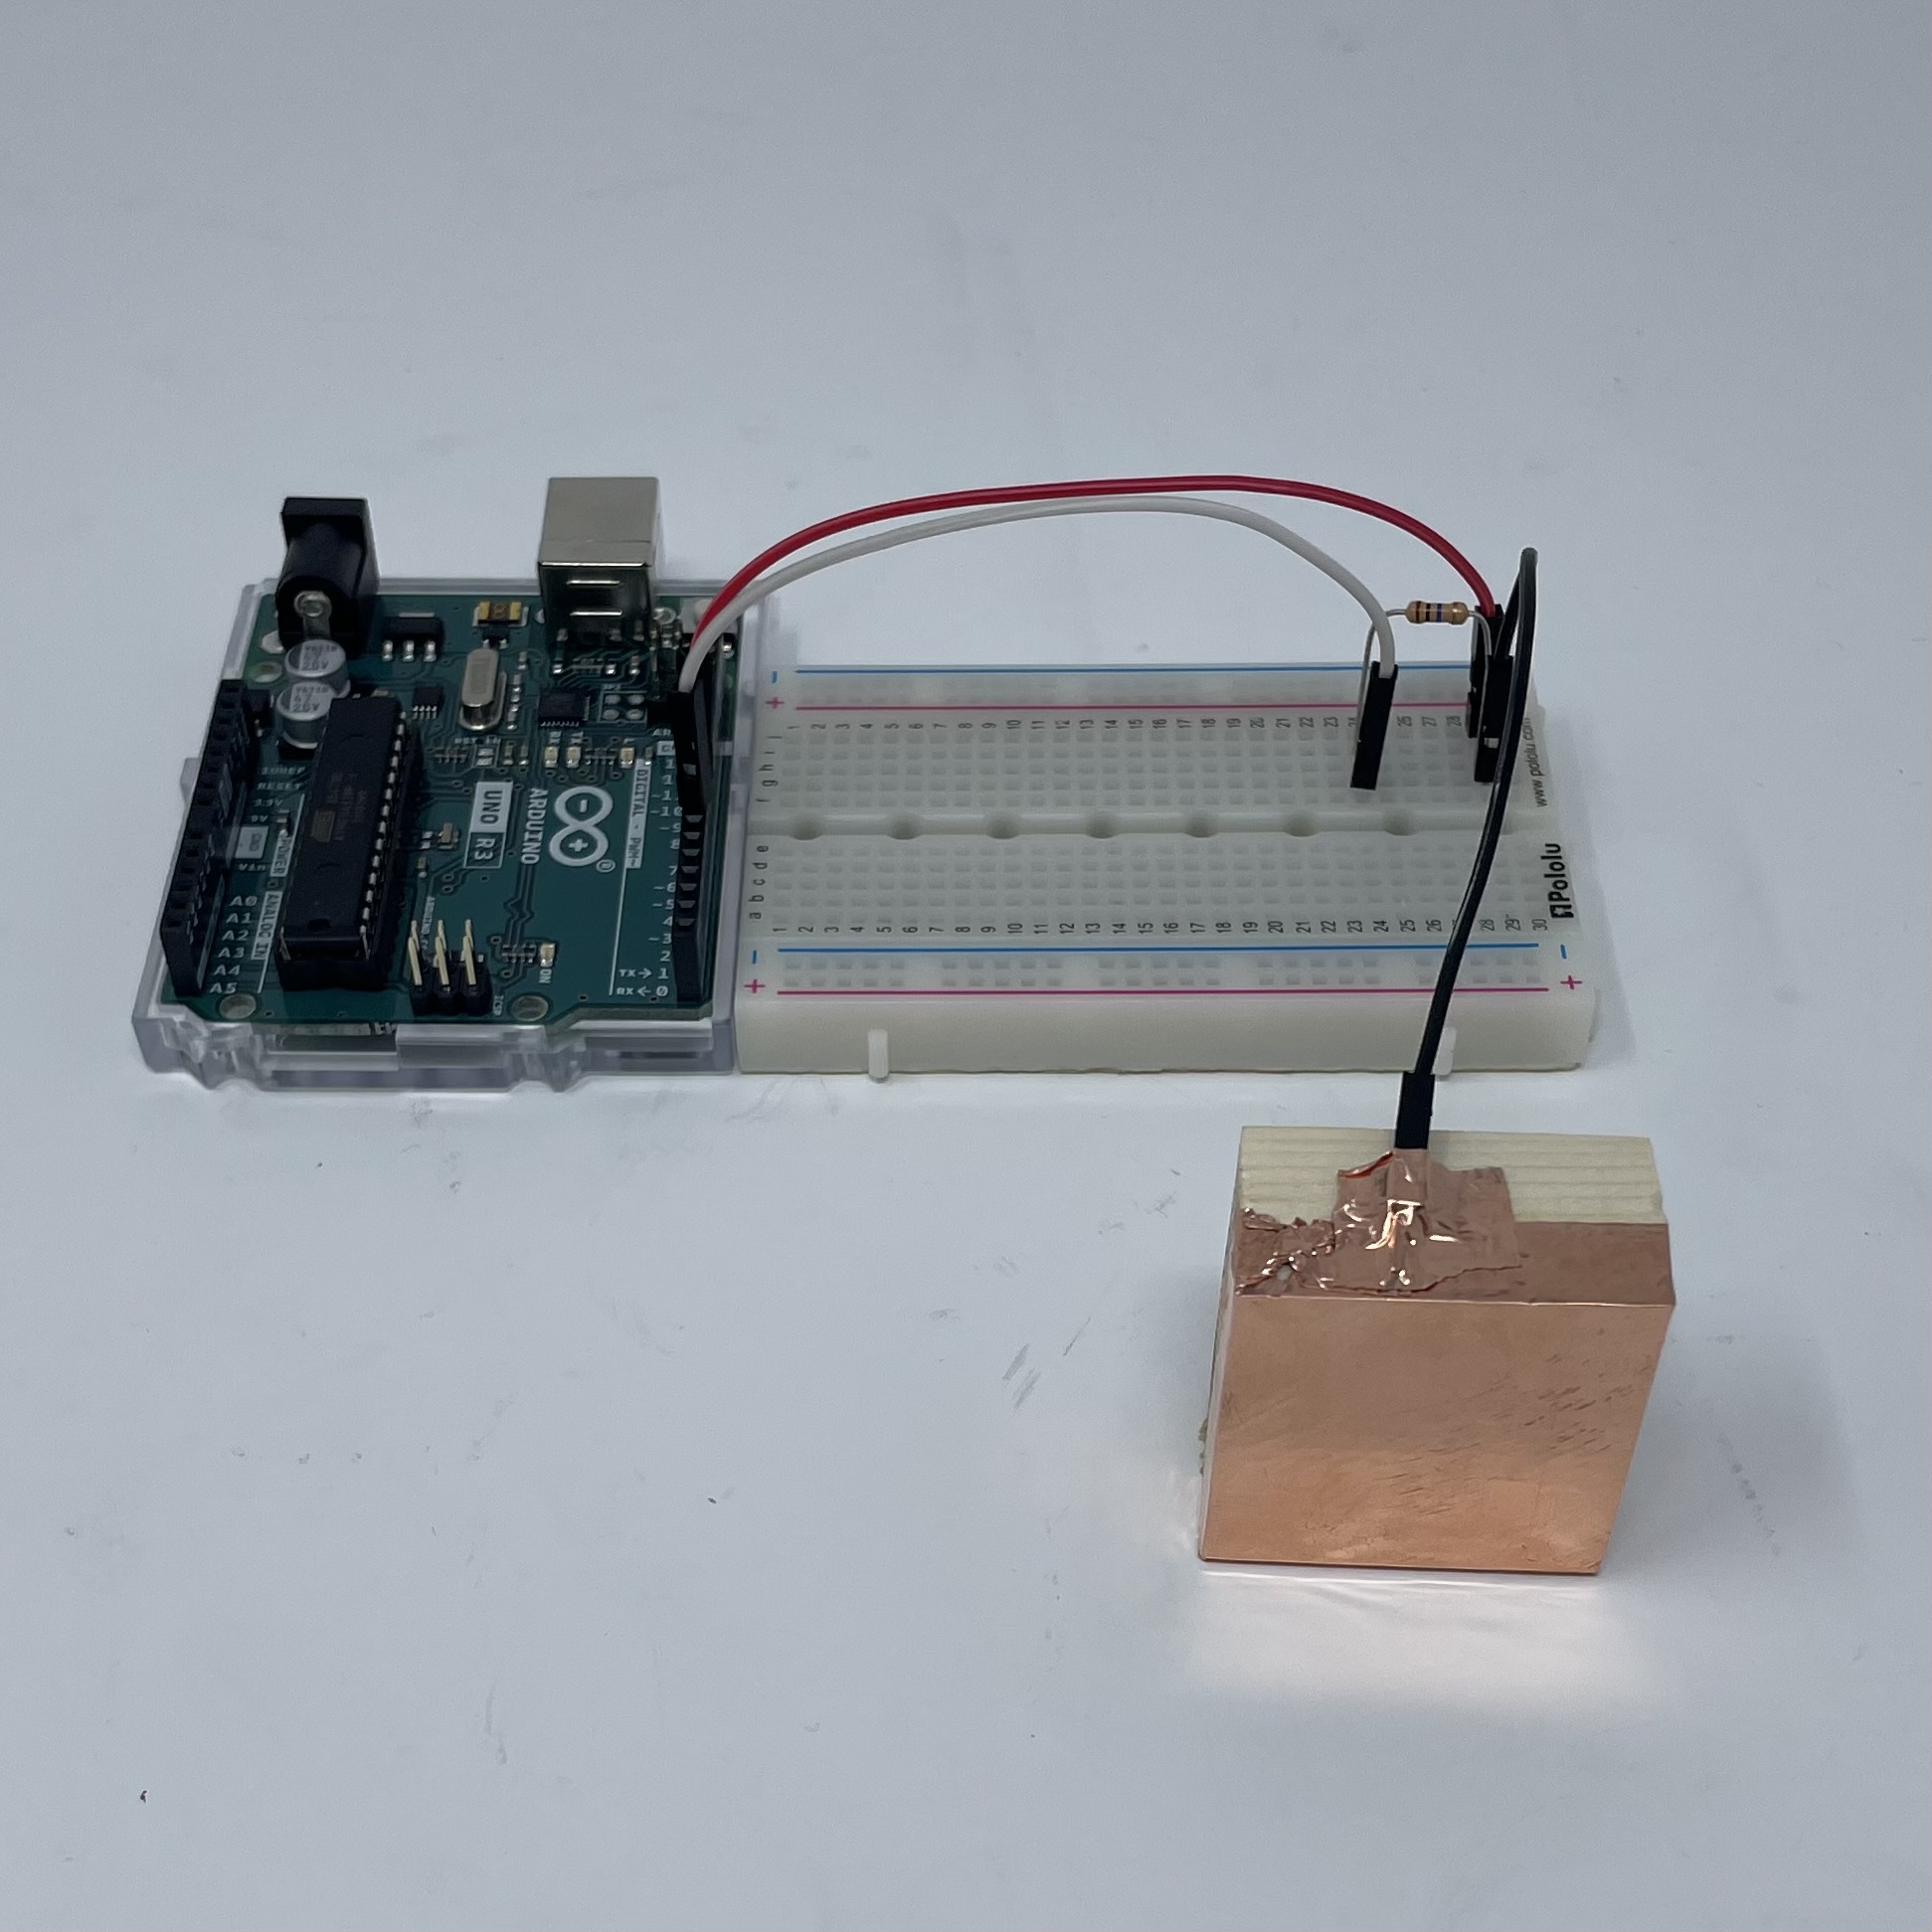
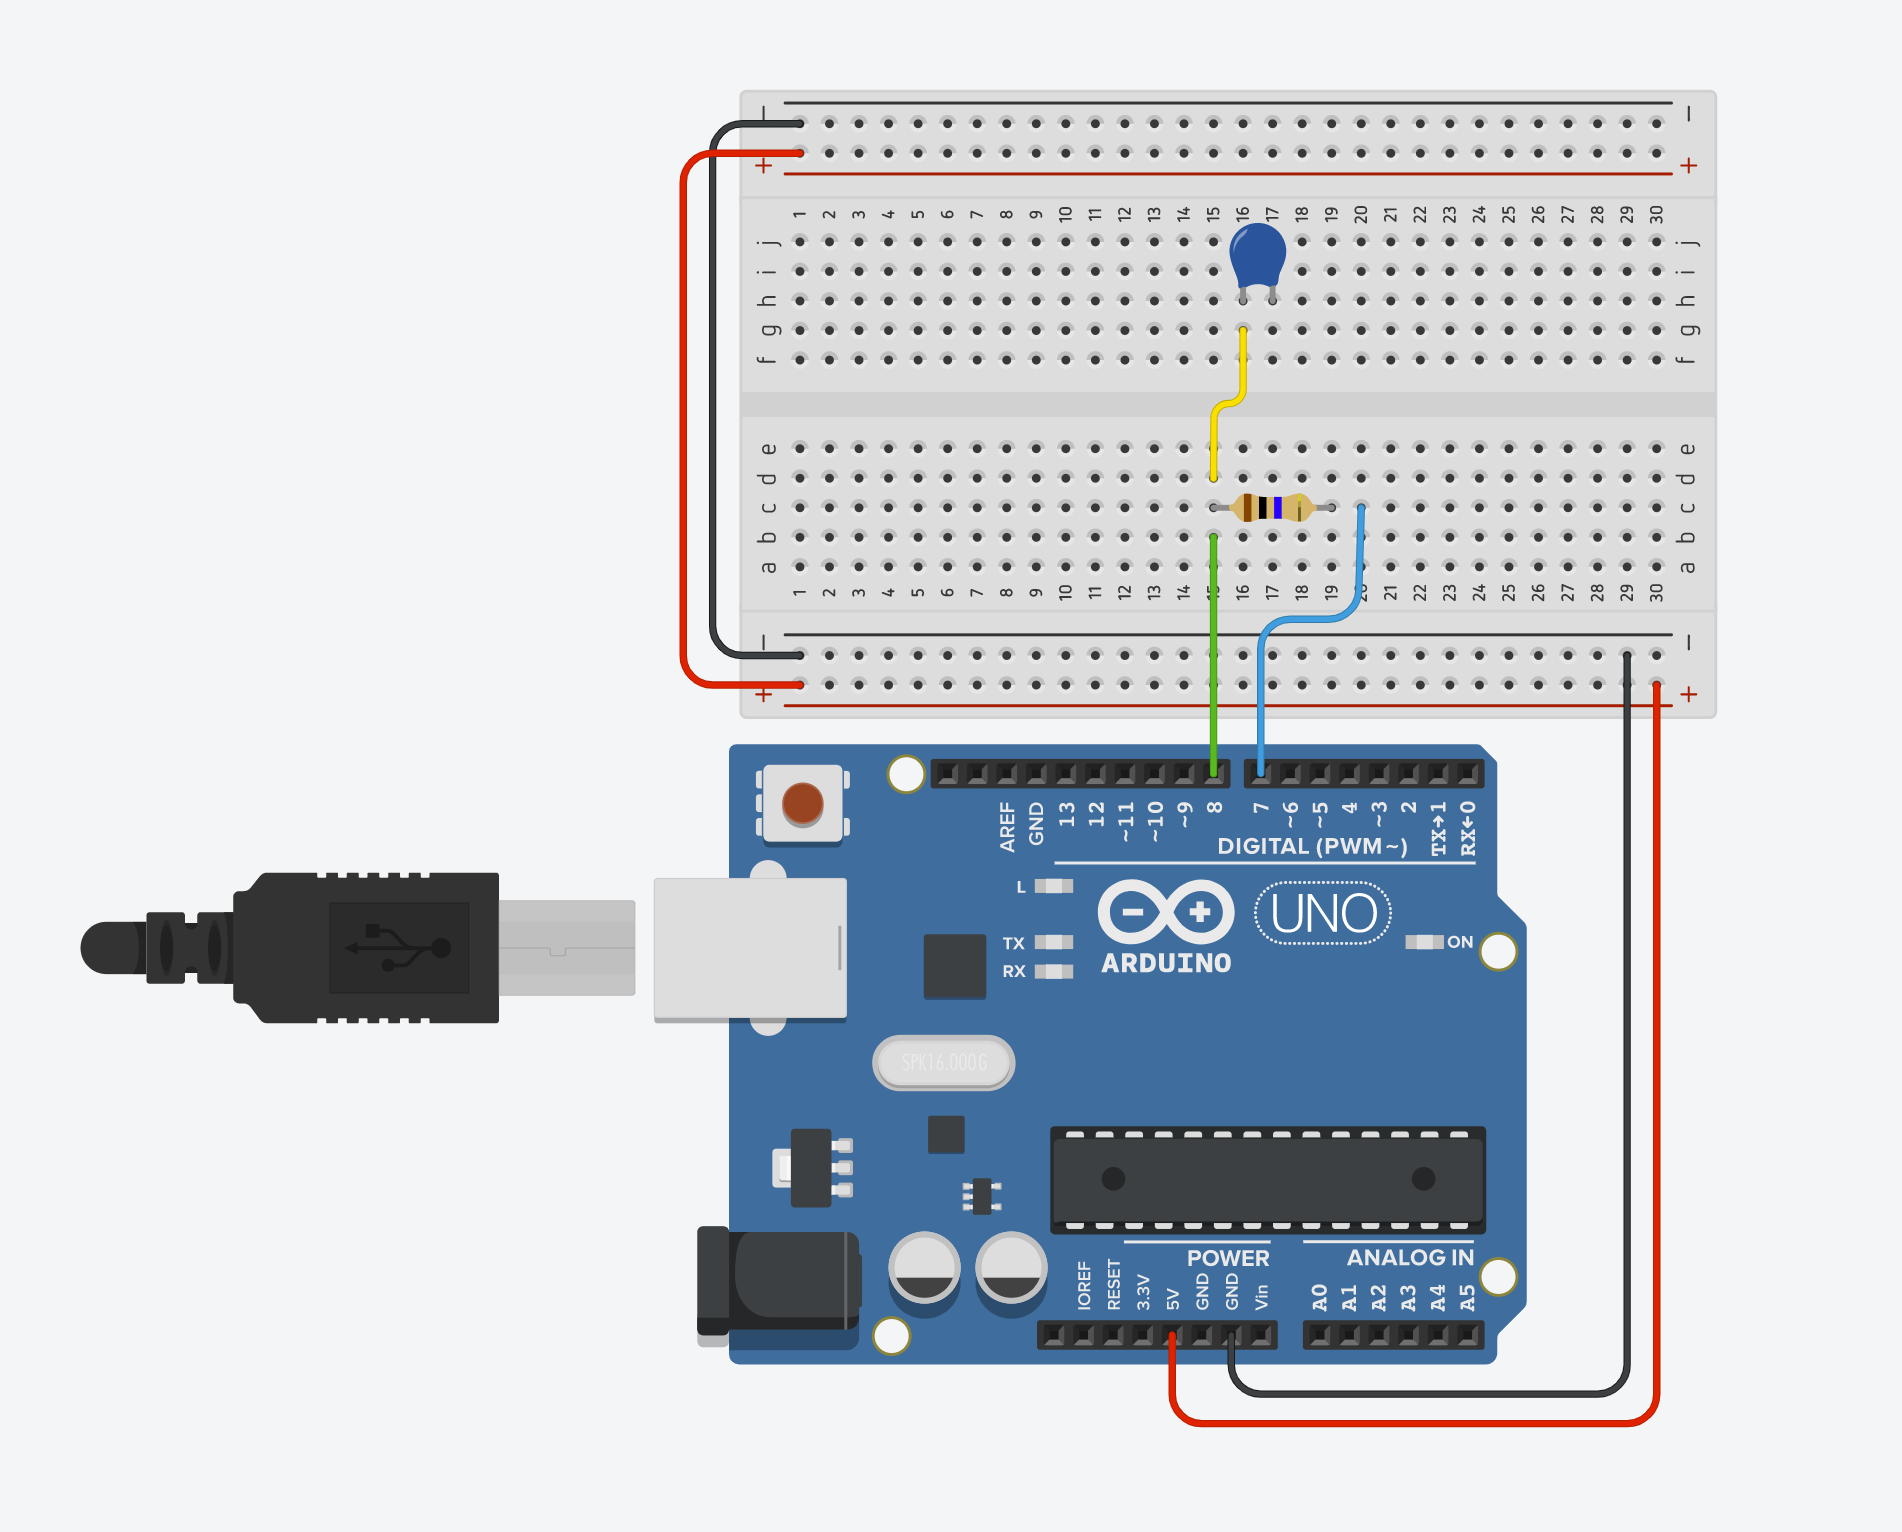
For this assignment, I decided to create a capacitive button. The physical quantity that my sensor measures is touch -- in an ideal world, the sensor maps the TOUCH event to 1 and NO TOUCH event to 0. In the real world, we read and write a bunch of differentials and, if no change occurs, we expect the value the sensor outputs to be relatively constant. On the event of a touch, the readings should surpass some sort of "threshold" which we define to be the difference between an untouched and touched button. For the schematic below, take the blue capacitor to be the wooden block with the copper foil on it. When touched, the second pin (GND) is connected to the toucher.
-
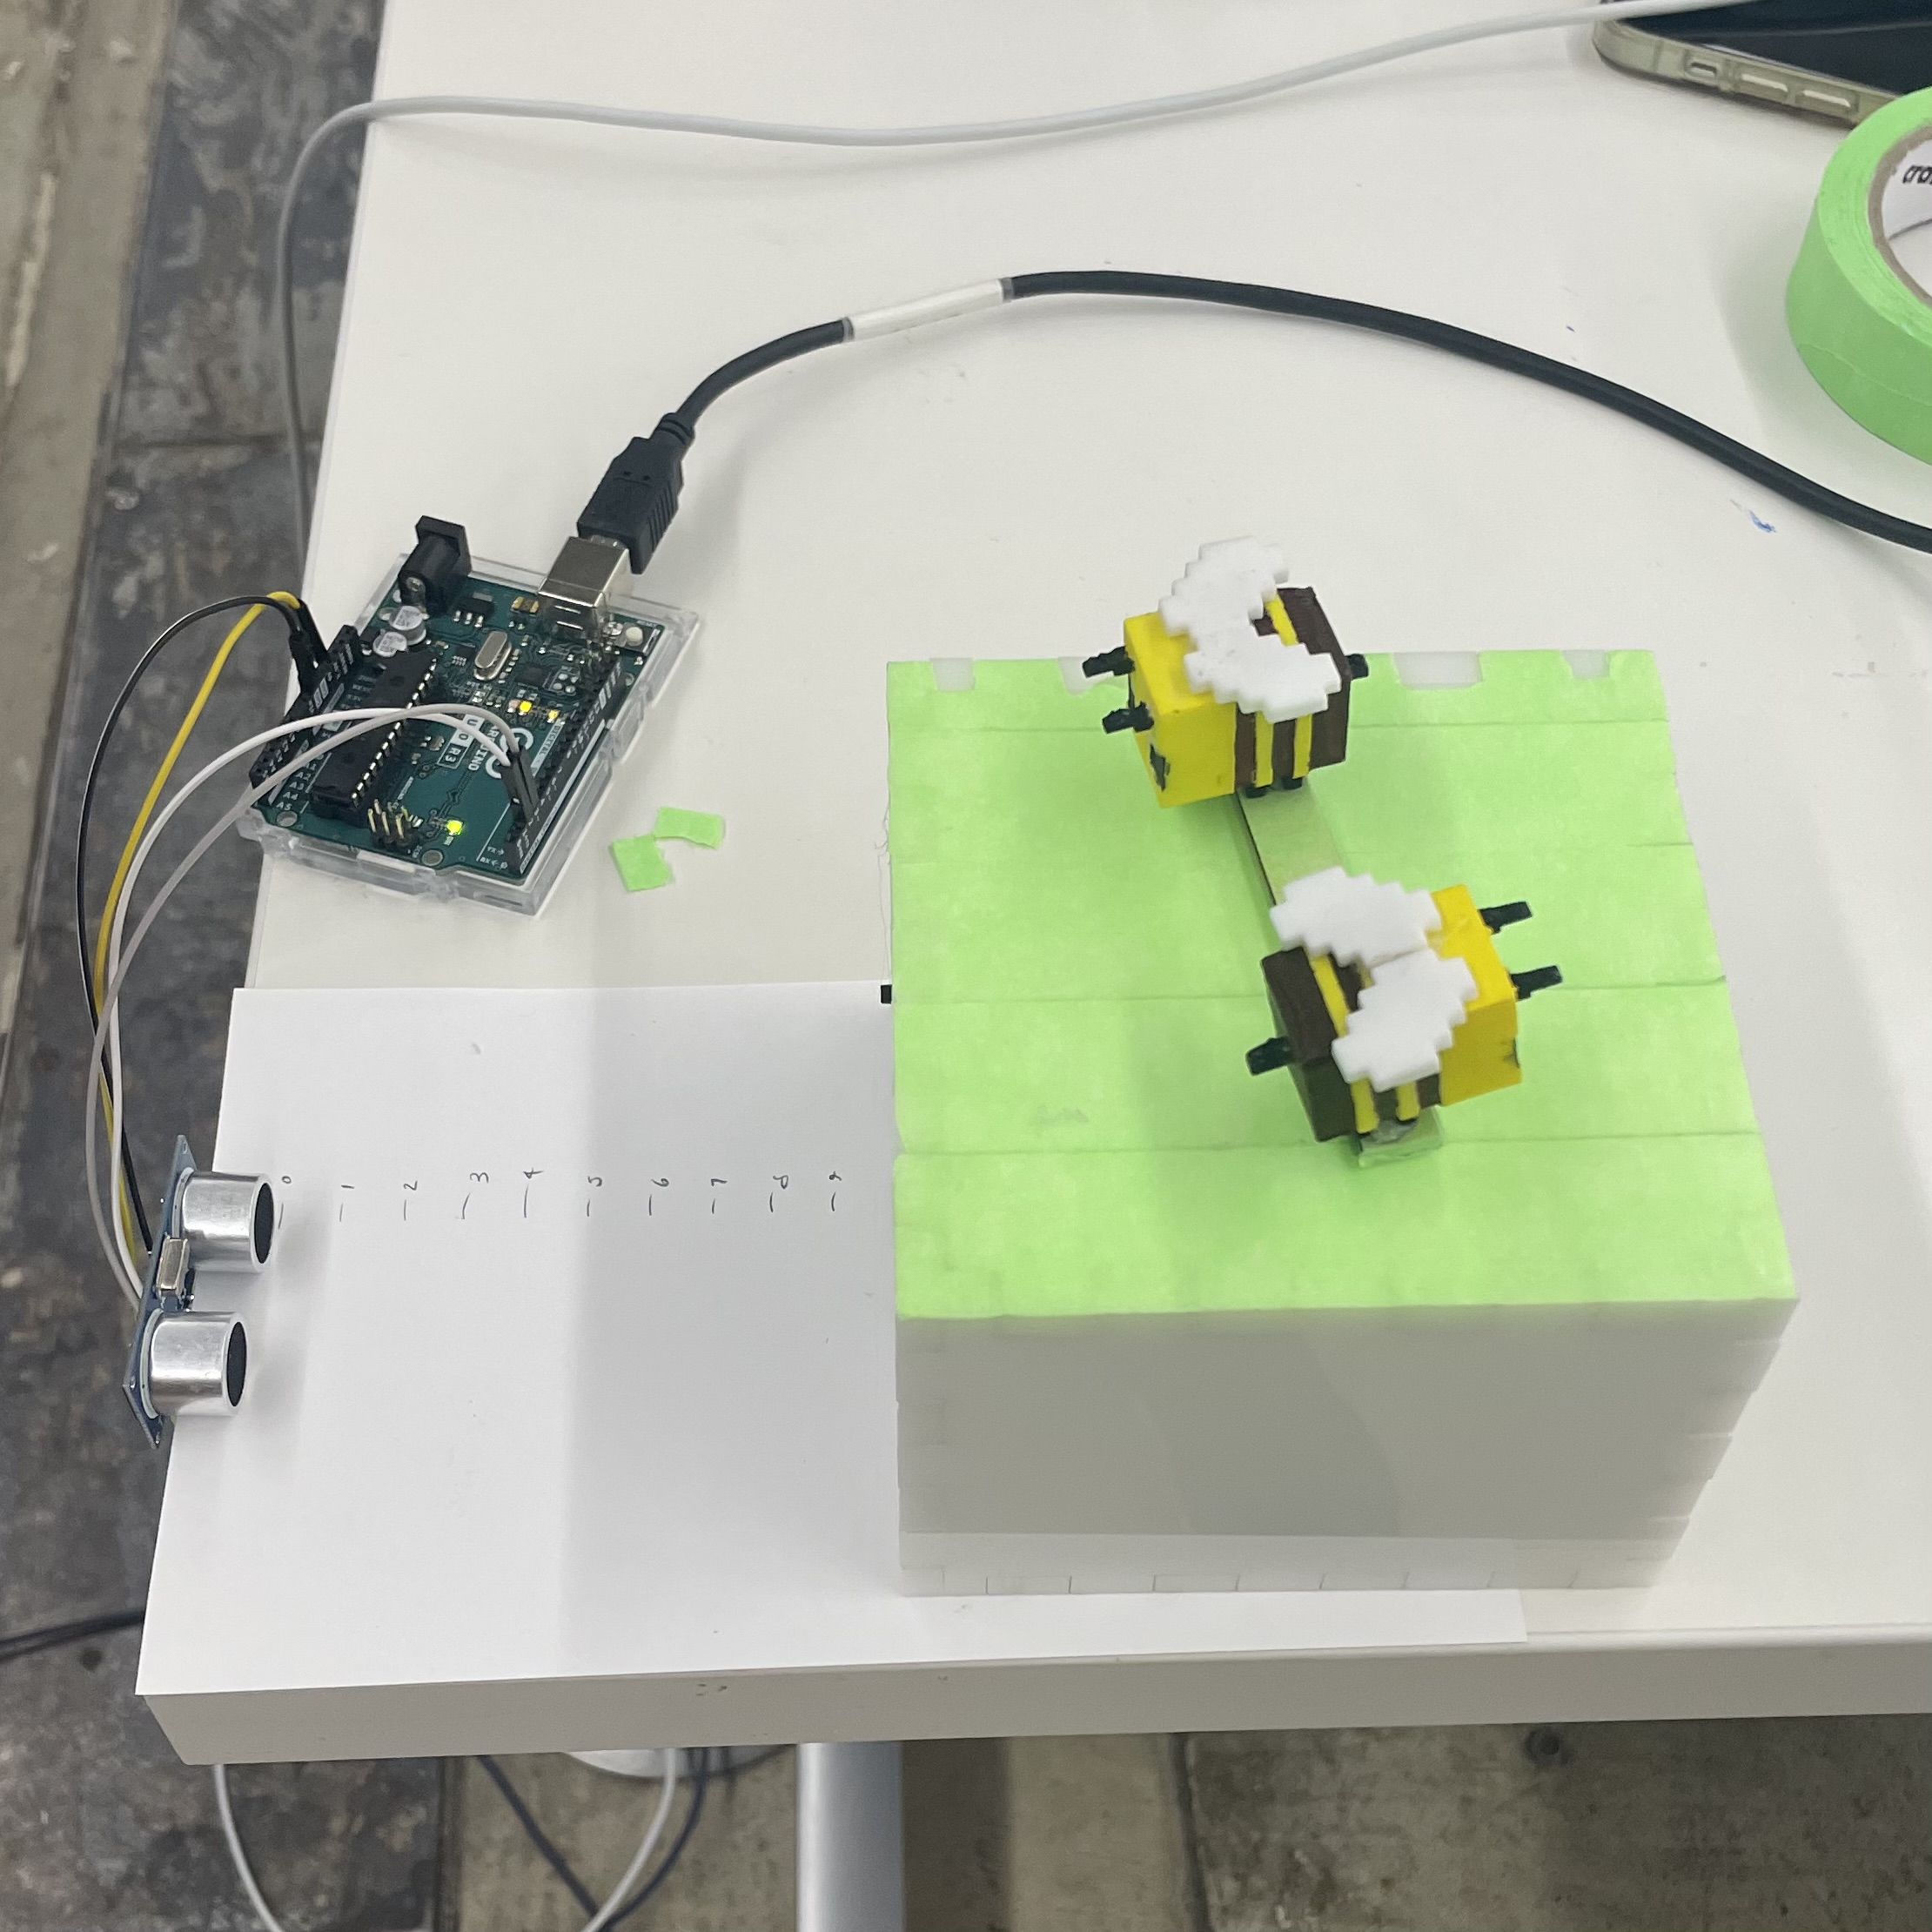
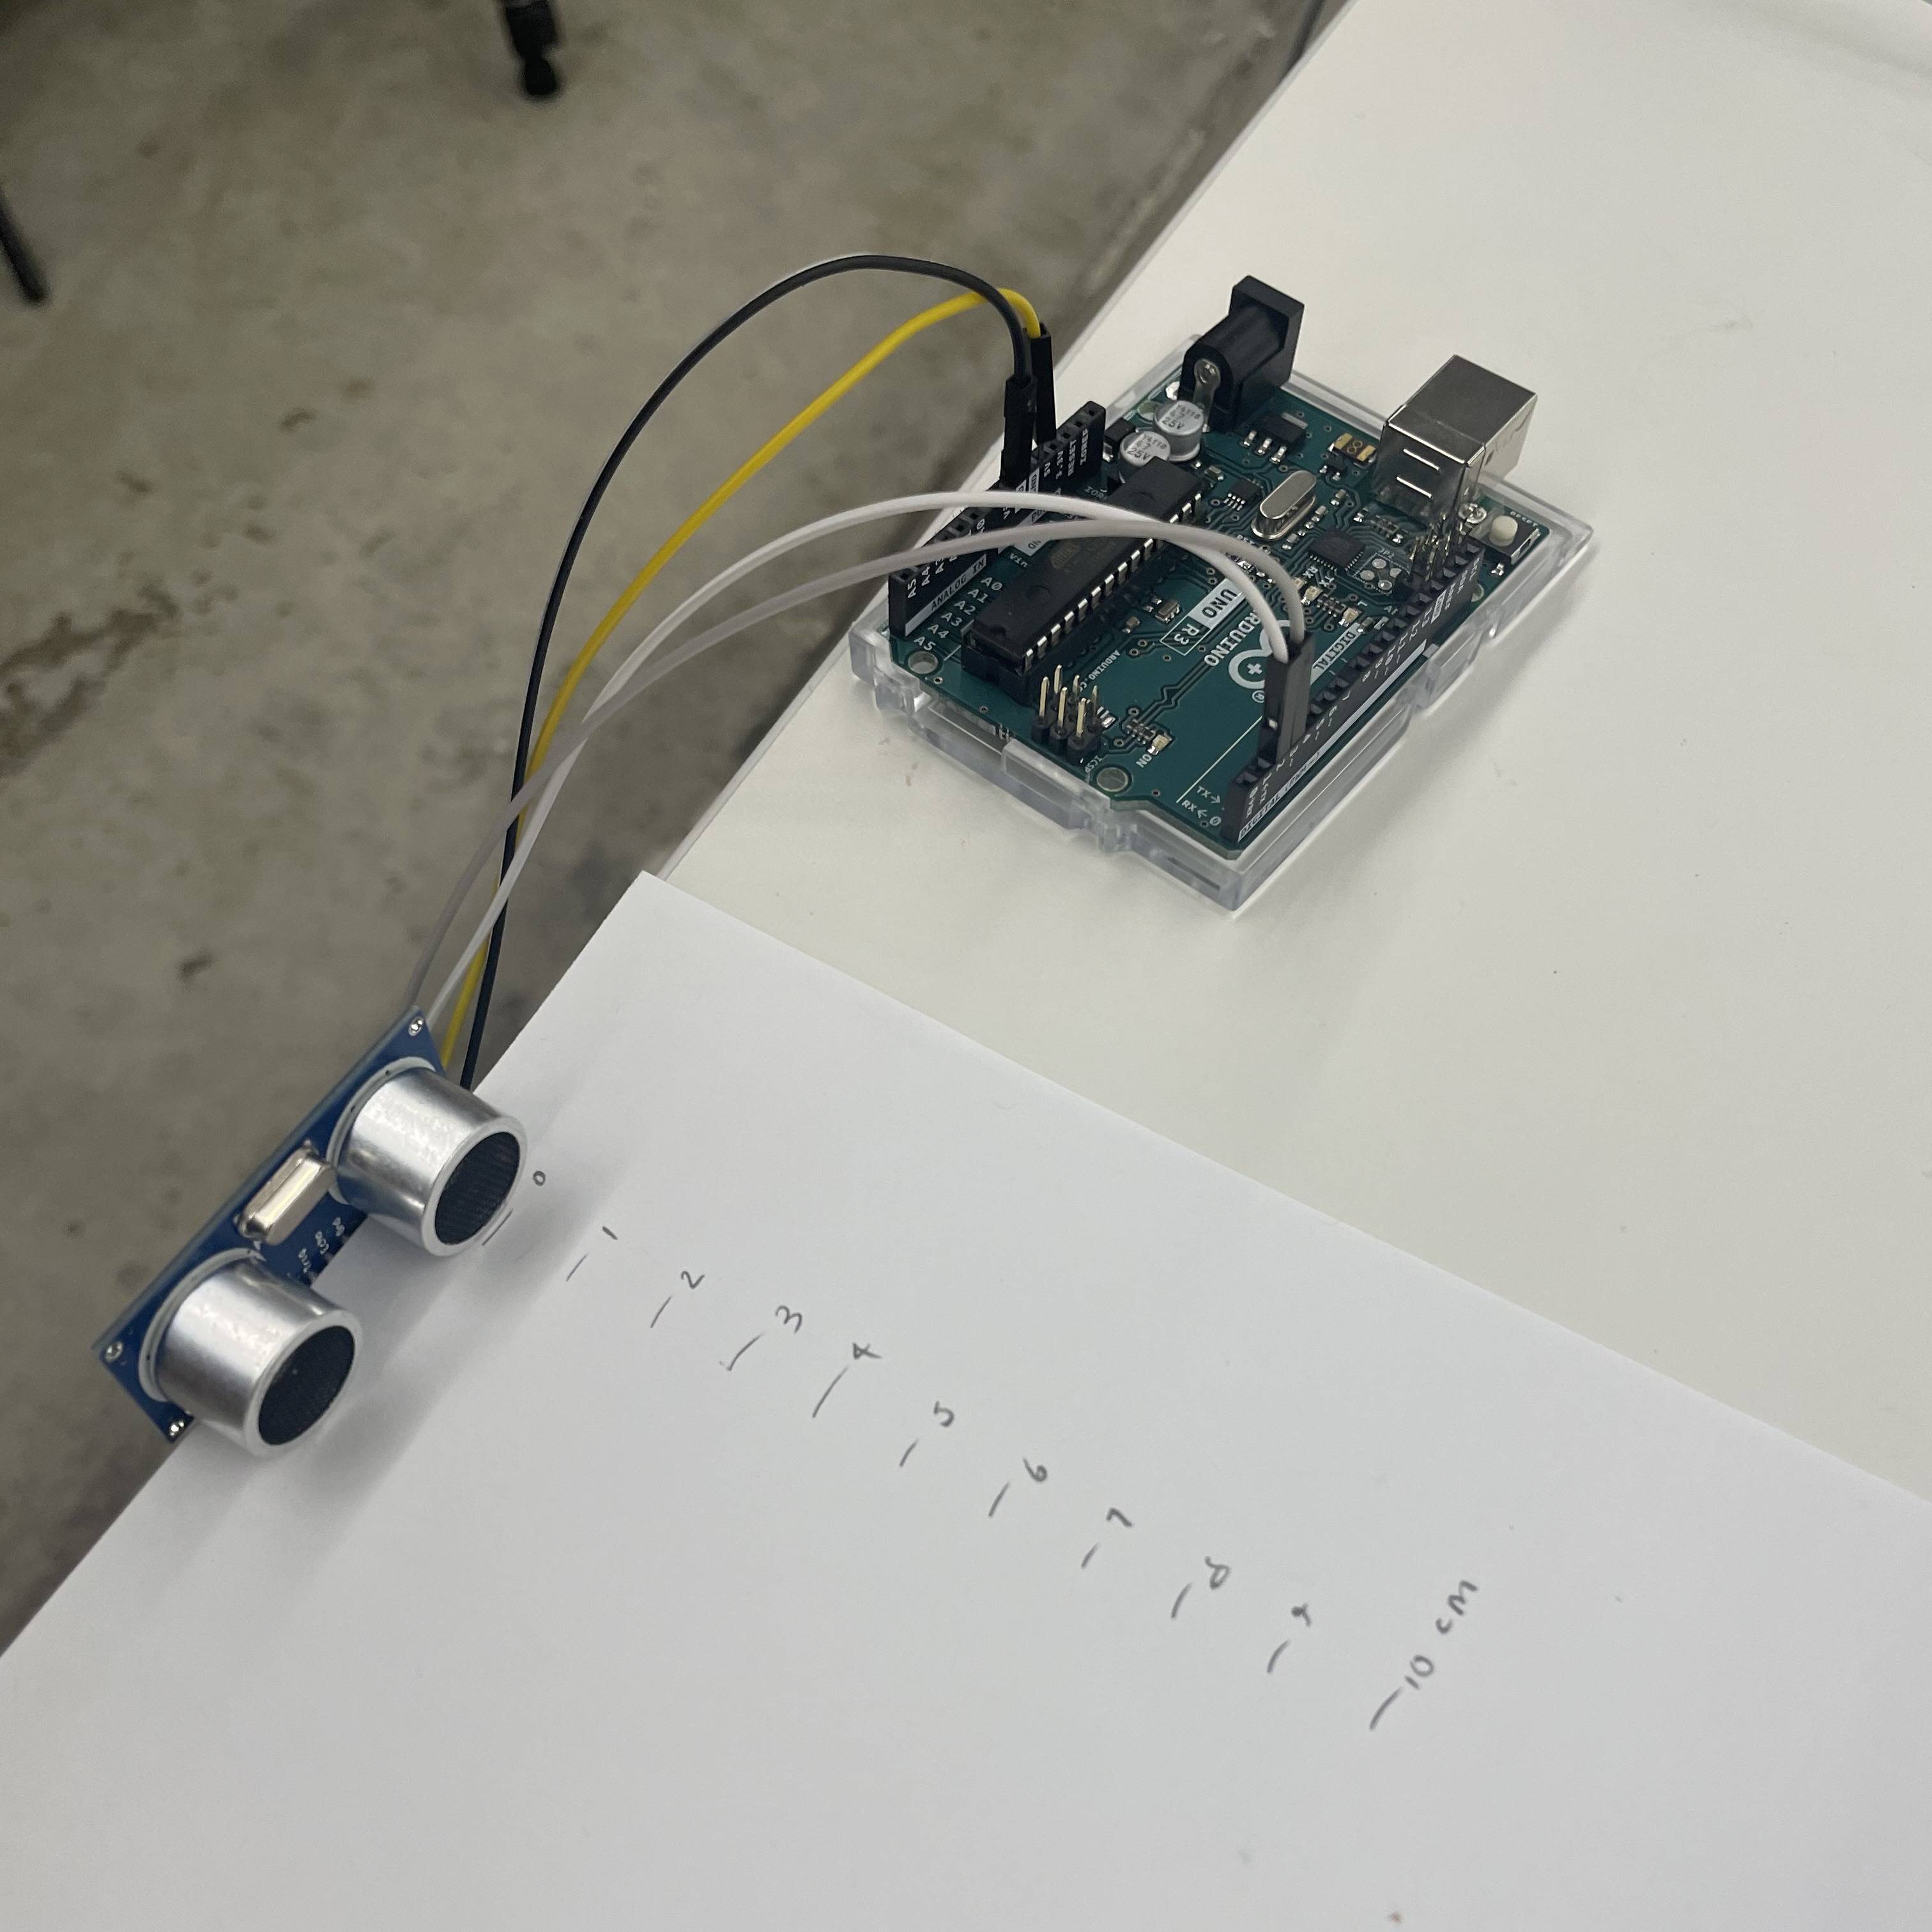
For this assignment, I wanted to use a sensor I was not yet familiar with, so I tried out the ultrasonic distance sensor. To my knowledge, this sensor uses SONAR to determine the distance between itself and an object. To measure distance, the sensor outputs a "ping" of sorts, and we measure the time it takes for this "ping" to reflect back to the sensor. Once we know how much time it took, we can turn this into a measurement for distance. Schematic:

Calibration
-
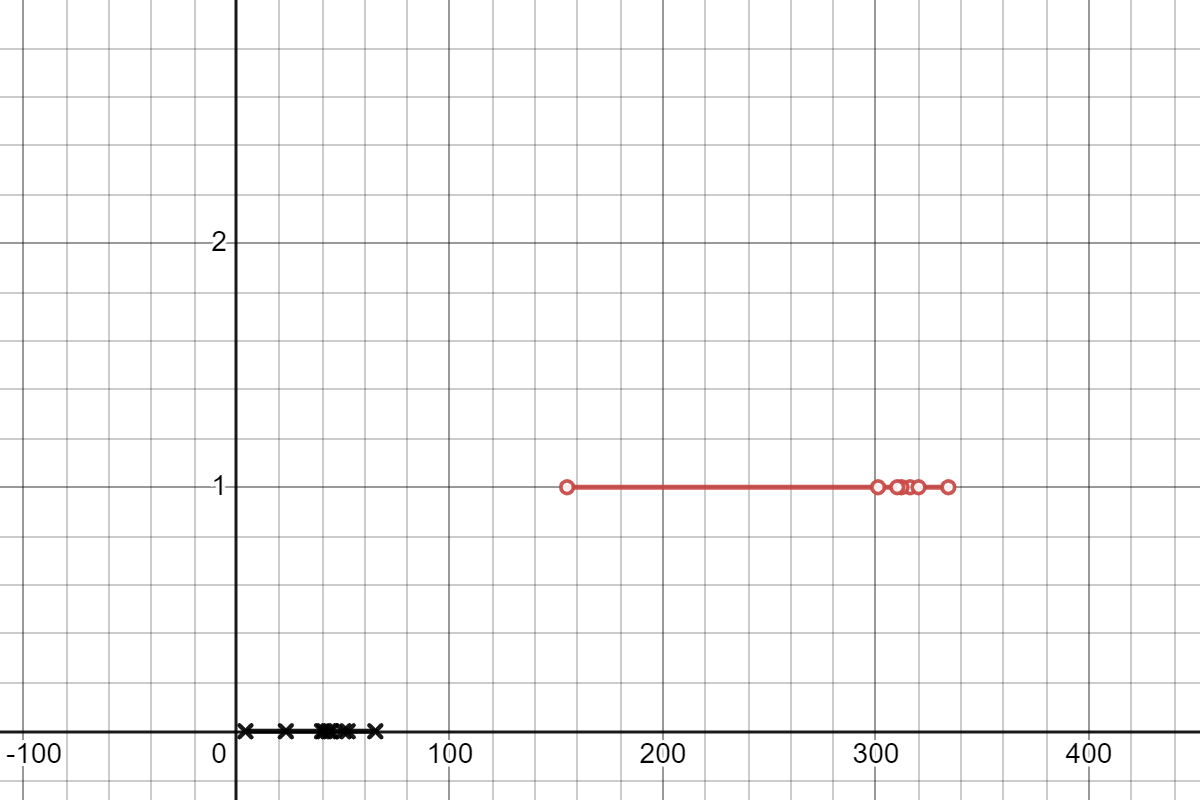
To make the button, I simply appended some copper foil to a wooden block (though the block is not necessary, it adds stability) and wired it up as we learned to in lab. Photos of the circuit are below. Using the code I wrote below, I got readings from the sensor. We take into account some "baseline" reading in hopes of only measuring the change of the sensor output from the baseline rather than the raw values. I found that the differential ("delta" value) of the untouched button tended to float around 4 to 50. The touched button returned differentials of significantly larger values, anywhere from 160 to 350. I calibrated by graphing a few of the outputted values versus the quantity they are measuring (y = 0 for NO TOUCH, 1 for TOUCH). This lead me to create a threshold of about 100.
-
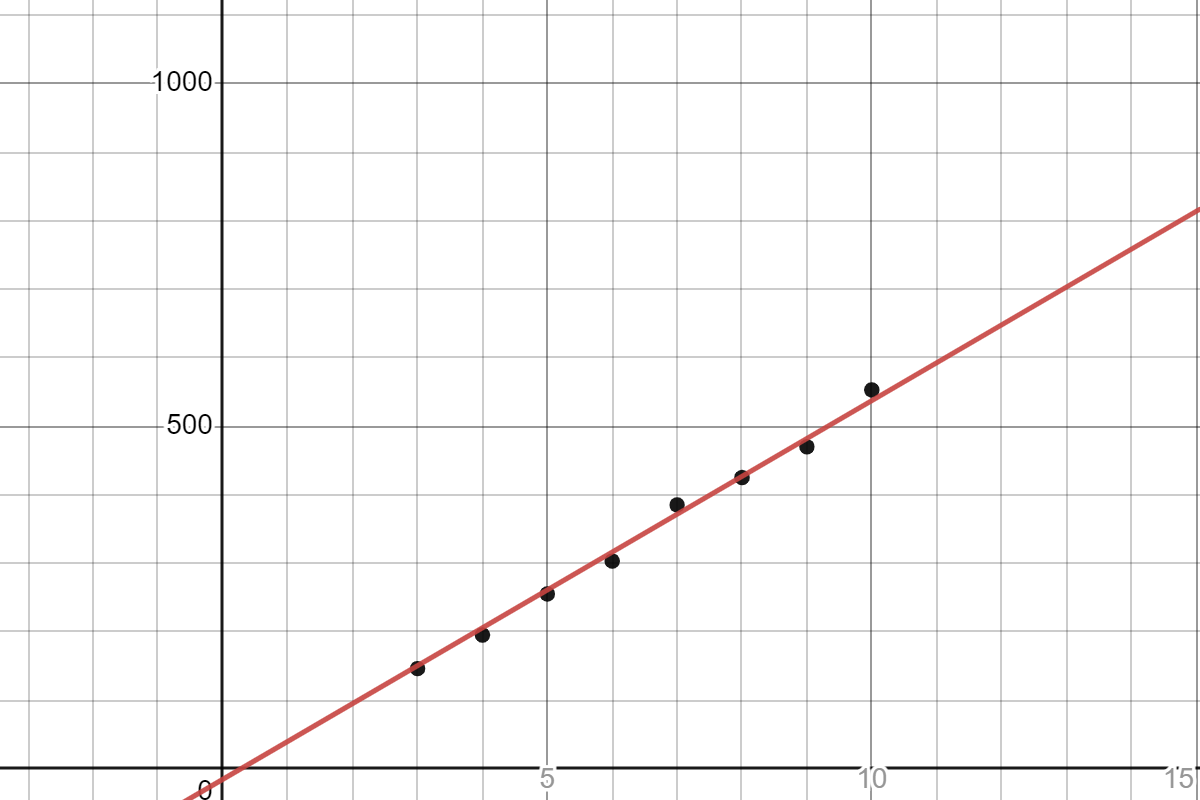
To calibrate the ultrasonic sensor, I positioned a large object (my kinetic sculpture) at various distances between 2 and 10cm from the sensor and plotted the output to input readings. Below is a plot of the real distance (on the x-axis) versus the reading from the sensor (y-axis). As we can see, the readings are fairly linear.
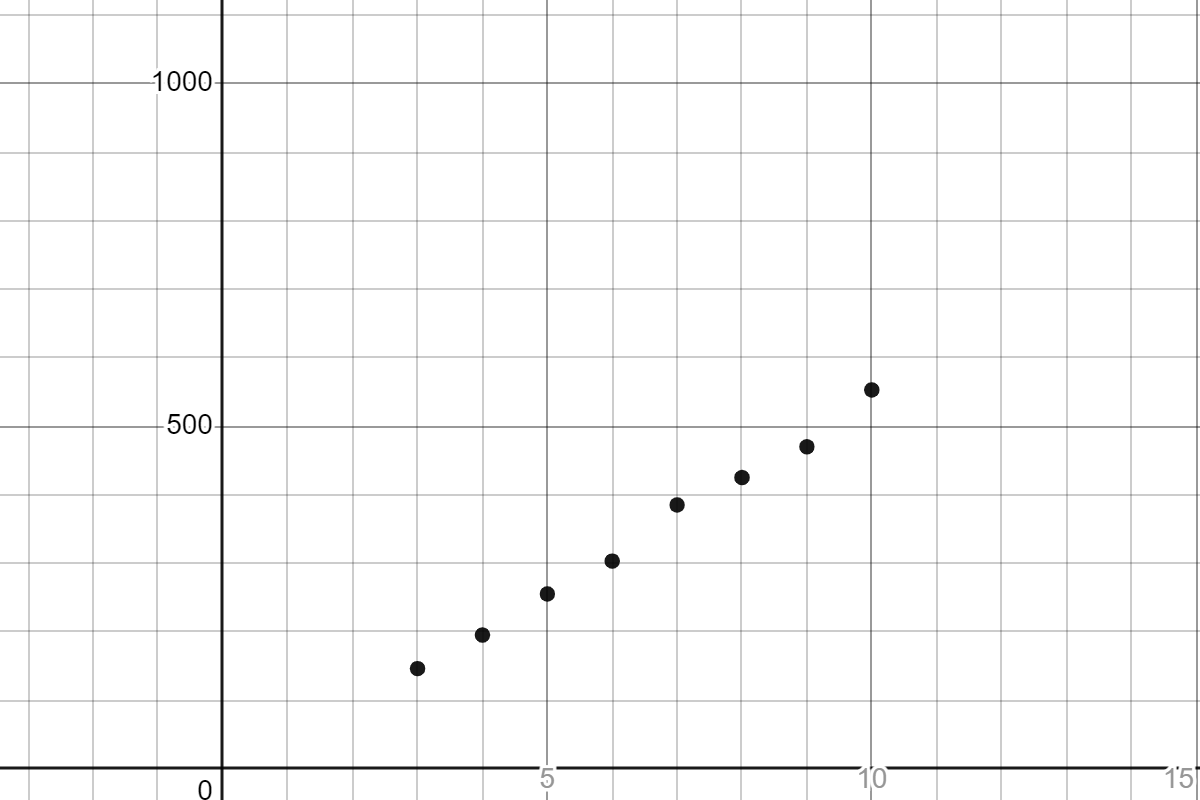
We then can use a linear regression calculator to fit the data, which gives us: distance = 55.3 * time - 15.6. Plotting this with the data: